The Moore Memorandum — Briefing 001
A briefing on how to turn financial truth into executable operations through unit economics, funnel arithmetic, lead indicators, and binding constraints.


A briefing on how to turn financial truth into executable operations through unit economics, funnel arithmetic, lead indicators, and binding constraints.
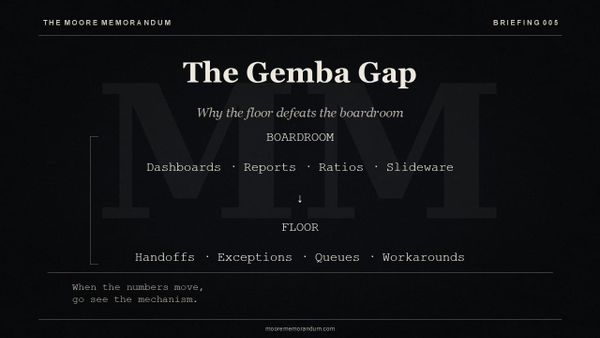
The boardroom sees outcomes; the floor contains the mechanism. This briefing explains how disciplined go-and-see practice helps leaders find the bottlenecks, workarounds, handoffs, and customer friction that dashboards average away.
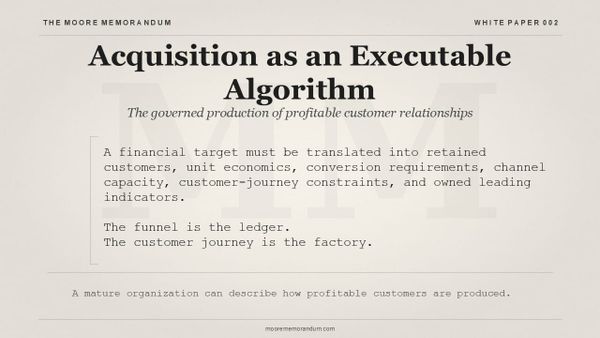
This paper argues that acquisition should be governed as the production of profitable customer relationships, with financial targets translated into unit economics, conversion requirements, capacity limits, customer-journey evidence, and leading indicators.
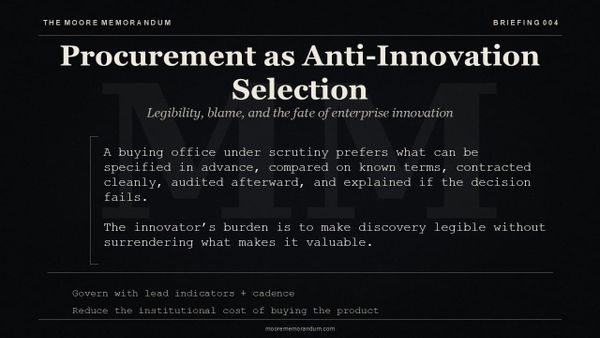
A briefing on how procurement systems shape innovation through specification, comparability, risk transfer, and institutional defensibility.
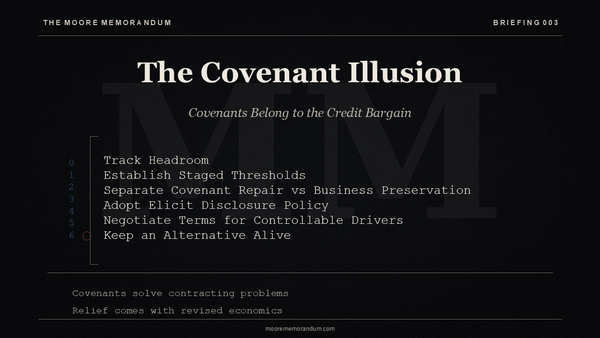
A briefing on why covenant relief is rarely simple time purchased, and how firms should manage credit covenants through contract-defined headroom, staged authority, disclosure discipline, and operating control.